
Description
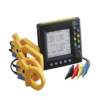
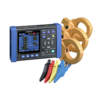
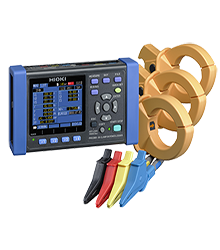
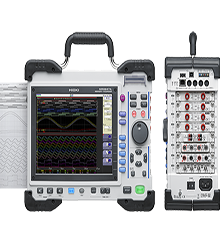
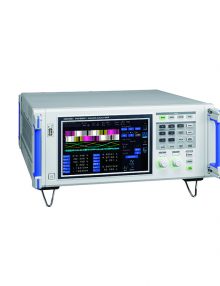
Hioki portable power meters and analyzers are best in class power measuring instruments for measuring single to three-phase lines with a high degree of precision and accuracy. The SF1001 is a software application for graphing measurement data captured with the PW3360/3365 series, 3169 series Clamp On Power Loggers using a computer. POWER LOGGER VIEWER
| SF1001 |
|---|
Key Features
• Trend graph display
• Summary, daily, weekly, and monthly reports
• Report printing
■ Basic specifications
|
Read-compatible model |
PW3360/3365 series, 3169 series |
|---|---|
|
Supported computer OS |
Computer running under Windows 8/8.1 (32/64bit), Windows 7 SP1 or later (32/64bit), Windows Vista SP2 or later (32bit), or XP SP3 or later (32bit) |
|
Trend graph display function |
[Display item] Voltage, current, active power, reactive power, apparent power, power factor, frequency, integrated active power, integrated reactive power, demand volume, demand value, voltage disequilibrium factor, Pulse, Harmonics (level, content, phase angle, total value, THD) |
|
Summary Display Function |
Displayed items are the same as for Trend Graph Display |
|
Waveform display |
Displays waveform data at specified data |
|
Harmonic display |
[List display]: Displays a list of harmonic data at specified date |
|
Copy function |
Captures any display image to the clipboard |
|
Print Function |
Preview and print content shown on the trend graph, report, harmonic graph and settings displays. |
|
Report printing |
Print (static) contents over a specific time period |


Reviews
There are no reviews yet!