CT Viewer™ is a full-featured TDR waveform analysis software package for Microsoft® Windows® XP / Vista PCs that lets you archive,manipulate, analyze, and compare TDR data acquired with CT100 Series Automated Metallic TDRs or any other TDR instrument, now with live internet streaming and remote control of CT100 Series TDRs. CT Viewer™ is included with CT100 Series TDRs. Read on to discover how CT Viewer™ will change the way you test cables. CT Viewer
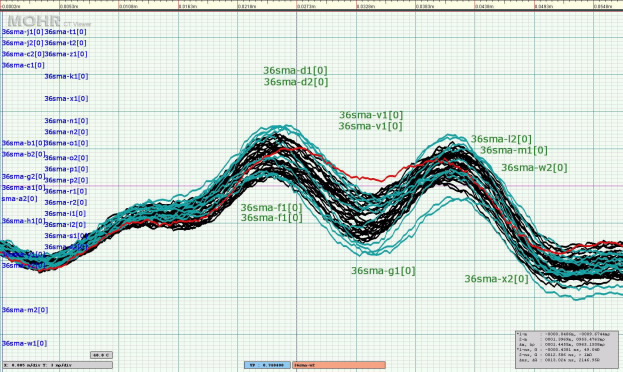
Figure 1 — Example screenshot from CT Viewer™ (click to enlarge). TDR traces from a batch of 50 Ω SMA interconnects has been called up for QC, highlighting impedance differences caused by slight variations in manufacturing. There is moderate variation even in this small batch of precision parts, one reason why the assumption that a given cable or interconnect is the same as another in a mission-critical system can lead to failures. CT Viewer™ is a powerful QA/QC tool that allows cable and interconnect manufacturers to fine-tune manufacturing processes, and lets customers quickly verify that their cables and interconnects are defect-free and will meet performance requirements of today’s microwave/RF and digital systems.
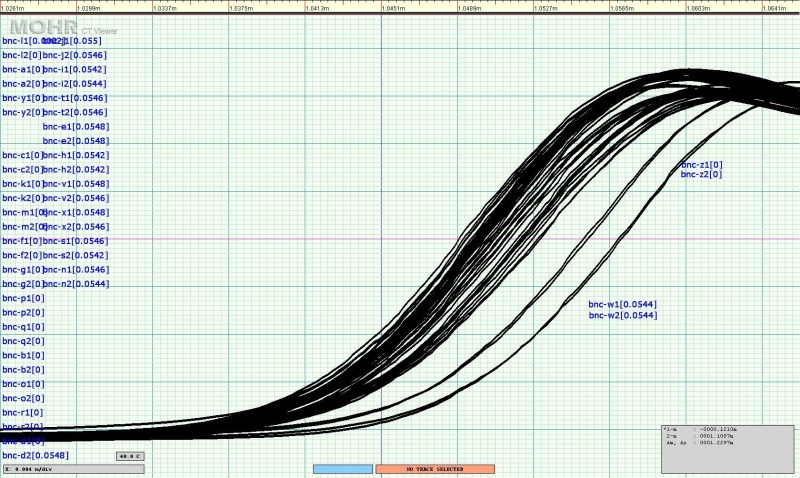
Figure 2 — Example screenshot from CT Viewer™ (click to enlarge). Electrical length comparisons of a batch of 1 m long 50 Ω BNC coaxial cables, showing cable end open faults. Horizontal scale is 4 mm/div. Even with this batch of short precision coaxial cables, there is moderate variation in electrical length with a range of approximately 8 mm. Physical measurement subsequently confirmed this variation was due to mechanical length variation. CT Viewer™ makes it easy to perform large-scale QA/QC checks on all types of cables and interconnects.
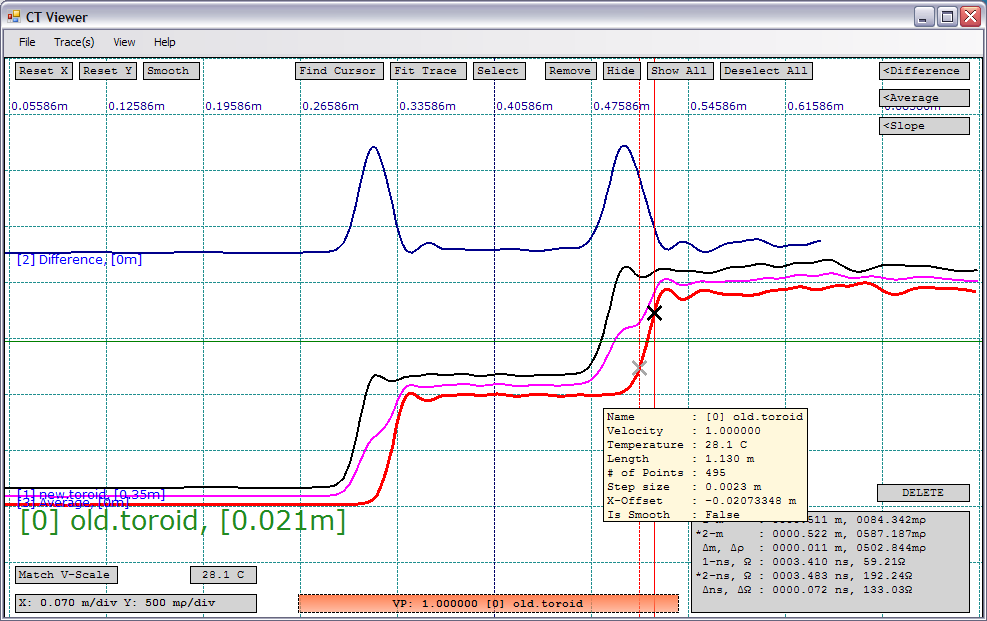
Figure 3 — Example screenshot from CT Viewer™ (click to enlarge). Two similar TDR waveforms (red and black traces) have been loaded, each showing the reflected rise on the left and an open fault to the right, just after the BNC connector. To show some of the features of CT Viewer™ the red trace has been shifted horizontally approximately 150 ps and a difference trace (blue trace) created from the original two traces. An average trace (magenta) has also been created. Two independent cursors are shown measuring the risetime of the open fault.
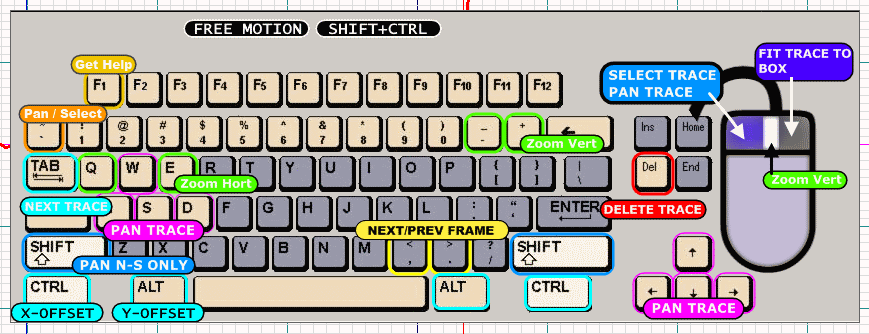
Figure 4 — Screenshot from CT Viewer™ with the help diagram loaded. A number of features are quickly accessible from the keyboard and mouse, giving you full control over how your TDR traces are displayed.
Quickly and easily archive all your TDR data
- Upload TDR waveforms from any CT100 Series TDR via 10/100Ethernet, USB, or USB thumbdrive for comparison in the office. Export TDR waveforms to any CT100 Series TDR for later comparison in the field.
- Import TDR waveform data from any other TDR instrument using standard comma-delimited CSV format files.
- CT Viewer™ runs on Microsoft® SQL Server® for dependable, enterprise-class relational database storage of all your Time-Domain Reflectometry test data.
Manipulate, compare, and analyze TDR waveforms
- CT Viewer™ reproduces all of the features of a CT100 Series TDR on your PC and includes a number of new features all its own.
- Powerful TDR waveform analysis features include dynamic independent horizontal and vertical scaling and translation of previously saved TDR waveforms. Measure or remeasure distance-to-fault (DTF), ohms-at-cursor, reflection coefficient, and more.
- Alter or fine-tune VoP (Velocity of Propagation) to 6 significant digits.
- Create new subtraction (difference), derivative, and other mathematical transforms of your saved TDR waveforms.
- Live Ethernet / USB streaming of TDR waveform data from any CT100 Series TDR, and remote control of one or more CT100 Series TDRs over a LAN / WAN or the Internet. Leverage engineering expertise from thousands of miles away.
Use CT Viewer™ to improve the way you perform TDR cable testing
- Increase the effectiveness of engineering oversight by separating the skills required for TDR trace acquisition from TDR trace analysis. With CT100 Series TDRs, only minimal training is required to acquire a high-quality scan up to hundreds of thousands of points that can be review later on CT Viewer™ by experienced personnel who may be located remotely.
- Keep a record of prior TDR scans from a given cable or cable harness; periodic maintenance testing with quick comparison to these prior scans could help catch subtle cable faults that could degrade signal quality, impair system performance, or potentially lead to system failure.
- Improve your QA/QC process by keeping a complete and accurate record of cable performance that can be reviewed later at any time, anywhere.
- View some examples of 50 Ω SMA and BNC coaxial cable quality control tests using the CT100/CT100HF and CT Viewer.