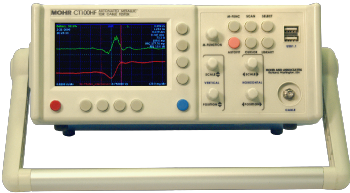
CT100 Series Automated Metallic Time-Domain Reflectometer (TDR) Cable Testers combine next-generation advances in time-domain reflectometry with labor-saving software features, long battery life, bright color screens, and industry-leading ergonomics. Read on for more details. CT100 Automated Metallic
Figure 1 — CT100HF TDR, SMA test port. The red trace is a previously-stored high-resolution TDR waveform of a 50-75 Ω SMA coaxial interconnect; this waveform can be repositioned or rescaled to display higher or lower detail. The green trace is the first-derivative of the red TDR trace; like other math traces, it will display changes dynamically if linked to a live TDR waveform. Click image for detail.
Figure 2 — Scanned TDR traces help detect subtle cable defects. A baseline waveform has been saved of a firmly seated BNC-SMA coaxial interconnect (top photograph, green trace). A waveform obtained sometime later shows a new impedance discontinuity (purple trace) corresponding to the female BNC port of the BNC-SMA adapter, which is still seated and conducting but no longer in the locked position (bottom photograph). A difference waveform (blue trace), normalized to 50 Ω, shows the associated partial cable fault as a deviation from the previously stored TDR waveform. Finally, the black (live) trace shows the trace after the loosened connector has been returned to the correct position. Click image for detail.
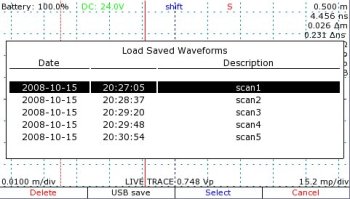
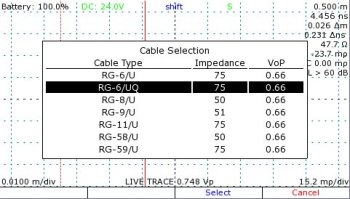
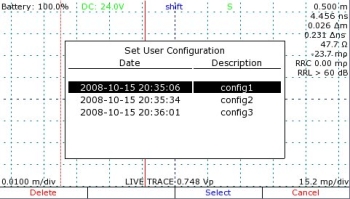
Figure 3 — Library of saved TDR traces (top): Saved TDR waveforms can be rescaled and translated horizontally and vertically, and compared with other live or scanned TDR waveforms.
Cable type library (middle), an easily-accessible library of industry-standard coaxial and twisted pair cable types is included. Add your own custom cable types.
Configuration library (bottom), lets you quickly set horizontal and vertical postion, vertical gain, cursor positions, and other TDR settings with a single keypress. Save a different configuration for each type of cable test you perform frequently to save time throughout the day.
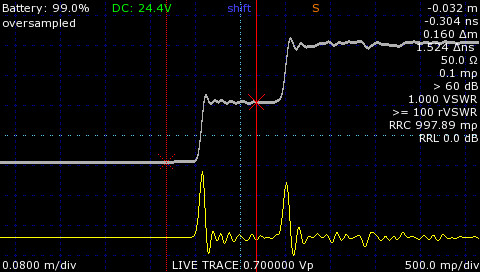
Figure 4 — 1st derivative TDR waveform. Apply math transforms such as the 1st derivative to live or saved TDR waveforms. The 1st derivative of a fast step TDR waveform emulates a very high-resoution pulse TDR waveform. The original step TDR waveform contains impedance information that the pulse TDR waveform excludes.
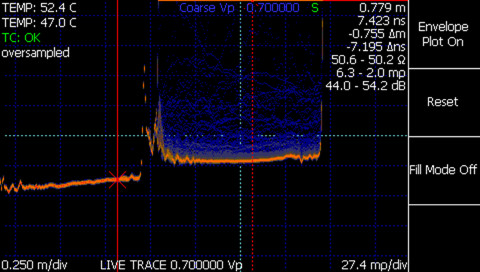
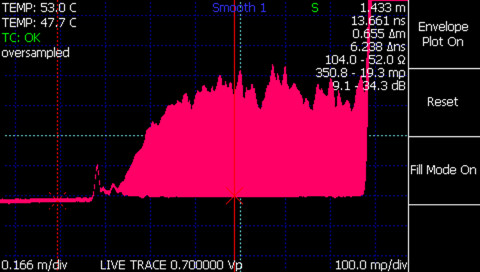
Figure 5 — TDR intermittent fault detection probability density (top): Intermittent / transient faults are displayed in probability density with min/max impedance-at-cursor measurements.
TDR intermittent fault detection min/max envelope (bottom): Intermittent / transient faults are displayed in envelope mode to emphasize worst-case cable and connector performance.
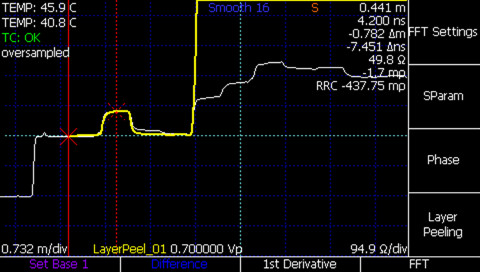
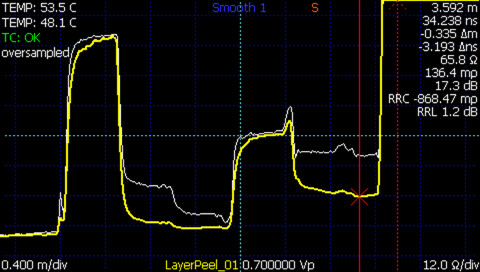
Figure 6 — TDR layer peeling of 50 Ω cable with 125 Ω segment (top): Layer-peeled TDR waveform (yellow) of a simple multisegment cable (50-125-50 Ω) accurately delineates the open fault at the end of the cable, while the original trace suffers from multiple reflections at the end of the cable.
TDR layer peeling of complex multisegment cable (bottom): Layer-peeled TDR waveform (yellow) impedance measurements from a complex multisegment cable (50-125-50-93-64 Ω) are considerably more accurate than those of the original waveform (white). The final cable segment’s true impedance measurement is within ~3 Ω of the measured value.
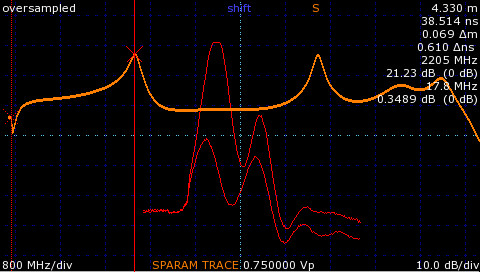
Figure 7 — S11 return loss comparison plot. The figure demonstrates scanned waveforms (red) of male-male 50 Ω SMA barrel adapter with the first connector tightened and then loosened. The orange waveform is the estimated S11 between the two waveforms demonstrating first peak return loss of ~2.2 GHz.
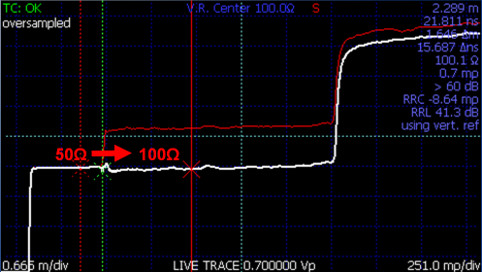
Figure 8 — Differential impedance measurement using VertRef and differential balun. True differential impedance measurements of twisted-pair and other differential cables can be made using VertRef and a 3rd-party differential pulse-splitter balun. In the figure, the green vertical cursor demarcates VertRef calibration with 100 Ω center impedance using a Pulse HFB050100 High Frequency Balun Adapter. The solid red cursor shows ~100 Ω differential impedance measurement from a CAT5E twisted-pair cable.
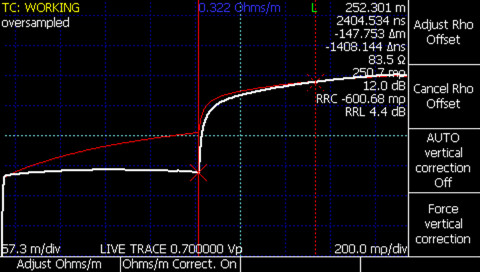
Figure 9 — Resistive cable loss (dribble up) correction. Correction for gross error in TDR waveform impedance measurements can be made using the Resistive Cable Loss Correction, in this case set at 0.322 Ω/m for a ~250 m 75 Ω(nom.) coaxial cable. This correction method enhances impedance measurements through long or lossy cables.
Unmatched high-resolution step TDR performance
- Step-rise signal with 60 ps (CT100HF) or 100 ps (CT100) 20-80% reflected risetime provides spatial resolution that is at least 8-10 times sharper than most competing devices.
- Horizontal cursor resolution of 0.76 ps, regardless of cable length, provides length measurement and localization of cable faults with up to 75 µm precision in standard coaxial cable (VoP=0.66), 100-1000 times better than most competing devices.
- Precision 16-bit sampling with industry-leading impedance accuracy — < 1% of measured value (< 1 Ω) from short to > 1000 Ω (typ.).
- Sequential sampling rates up to 250 kHz (500 full TDR frames/sec) lets you capture transient cable impedance changes and implement sophisticated digital filtering(shown below).
- Need more precision when you measure cable length? CT100 Series TDRs let you select VoP out to 6 digits. In concert with 75 µm horizontal cursor resolution, this lets you measure cables of any length with unprecedented accuracy.
Innovative time-saving features
- Get quick differential measurements with the CT100’sdual cursors (Figures 1, 2).
- Shift function using the multifunction (M-Func) knob lets you shift the entire selected trace horizontally. If a scanned trace is selected, it is translated horizontally independent of the other traces on the screen.
- Dedicated function buttons minimize soft-menu navigation and save time:
- M-Func — Selects function of the M-Func knob.
- Scan — Brings up the scan function menu.
- Library — Loads the scan, configuration and cable library menu.
- Select — Cycles through selectable TDR traces (live and scanned) on the screen.
- AutoFit — Fits the cable onto the screen.
- Cursor — Toggles the active cursor.
Cable scanning
- Scan a cable at high resolution, store it in your waveform library, and call it up later for comparison with live or other stored TDR waveforms at any time, either on the device itself or on CT Viewer™ (Figures 2, 3).
- Select and independently translate and vertically scalescanned TDR traces for direct comparison with other TDR traces.
- Apply math transforms to scanned and live TDR waveforms: subtraction, 1st derivative, and more (Figures 2, 4).
Configuration and cable libraries
- An industry-standard cable-type library is at your fingertips. Add new cable types as needed with VoP precision of up to 6 digits. See Figure 3, middle panel.
- Save time setting up cable tests. Store cursor position, horizontal and vertical zoom, and other settings under a unique name in the configuration library and reapply them at any time. Set up as many configurations as you want. See Figure 3, bottom panel.
Advanced TDR Features
- CT100 Series TDRs feature many of the advanced features you might expect from benchtop instruments, geared for portable cable and wire testing.
- Intermittent Fault Detection detects transient faults down to 2 ms temporal resolution with unlimited detection interval; faults are displayed as either min/max envelope or probability density plot, with min/max impedance-at-cursor (Figure 5).
- Layer Peeling dynamic deconvolution transform helps correct for impedance errors caused by multiple reflections, for instance in multi-segment compound cables (Figure 6).
- ZTrace transforms reflection coefficient to estimated impedance for easier interpretation of the TDR waveform in Ohms (Figure 6).
- FFT-between-cursors and S11 scattering parameters(beta status), useful for estimating frequency-specific return loss and insertion loss (Figure 7).
- VertRef Spot Calibration improves accuracy of local impedance measurements and calibrates impedance matchers and differential baluns for enhanced accuracy when testing non-50 Ω coaxial cables and differential twisted-pair cables (Figure 8).
- Resistive Cable Loss Correction enhances impedance accuracy at the end of a long or lossy cable by removing so-called “dribble up” error due to resistive cable losses (Figure 9).
Communication and collaboration
- Live Internet streaming of TDR waveform data from and remote control of any CT100 Series TDR, from next door or from thousands of miles away.
- Upload your TDR waveform data to your Microsoft® Windows® XP / Vista PC running CT Viewer™ via 10/100 Mbit Ethernet or client USB.
- Full integration with CT Viewer™ lets you share and compare your TDR waveform data with others and upgrade your device with the latest features.
- Front-panel USB host functionality, compatible with barcode readers, keyboards, USB thumbdrives, and more.

