Description
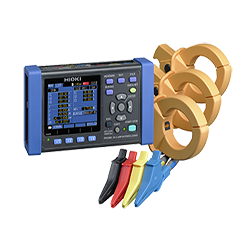
Hioki E.E. Corporation is pleased to announce the launch of the Clamp On Power Logger PW3360-21 for advanced energy logging and power efficiency analysis. The new power logger adds harmonic measurement functionality to the PW3360-20, which was launched in December 2012. Hioki Clamp On Power Meters PW3360
Today power inverters are being broadly applied as the energy-saving performance of electrical devices continues to improve and solar power systems become increasingly popular. Yet while inverters are contributing to both of these trends, they also emit harmonics that can interfere with the proper operation of electrical devices and the electronic components they use. Demand for harmonic analysis capability is growing due to the need to limit its adverse impacts. HIOKI CLAMP ON
PW3360-21 Hioki Clamp On Power Meters PW3360
PW3360-21-01/100
PW3360-21-01/500
PW3360-21-01/1000
PW3360-21-01/5000
The PW3360-21 can measure harmonics found on voltage and current signals, and can display a variety of measurement parameters, including harmonic RMS values, content percentages, and phase angles, in both list and graph form. It can also save measured values on an SD memory card at a user-specified interval. Moreover, the optional Power Logger Viewer SF1001 PC application can be used to display time-series graphs of harmonic data on a computer, further aiding in harmonic analysis.
“The PW3360-21 takes the PW3360-20 one step further by enabling customers to capture critical harmonic data while managing their power, providing even higher work efficiency and analysis capabilities,” comments Hioki lead engineer Sadanori Miyajima.
Harmonics and Their Effects HIOKI CLAMP ON
Many electrical devices and equipment sold today utilize power inverters, which are used to improve energy-saving performance due to their ability to control the frequency, voltage, and current of AC power supplies. Power inverters are often seen in both industrial and consumer products such as air conditioners and electric vehicles to lower power consumption and improve fuel economy. Inverters also are used in solar power systems, where they are needed in order to convert the DC power generated by solar panels into the AC power used by household appliances.
Power inverters improve energy-saving performance and aid in the use of natural energy sources, but they also emit harmonics, which are defined as electricity waveforms with frequencies that are integer multiples of standard power supply frequencies.* These harmonics have adverse effects on electrical equipment and devices as well as the electronic components they use. For example, they can cause video images displayed by household electronics to exhibit flickering and noise; computers to malfunction; and capacitors and fuses in devices to overheat or burn up. Depending on the extent of such heating, the risk of fire may also increase.
Consequently, demand for instruments that can analyze harmonics is heightening due to the need to limit harmonics.
*It is especially important to limit the third harmonic, which is three times the fundamental wave, and the fifth harmonic, which is five times the fundamental wave.
Key Features of the Clamp On Power Logger PW3360-21 HIOKI CLAMP ON
1. Analyze harmonics up to the 40th order
The PW3360-21’s harmonic analysis function can analyze harmonics of up to 40 times the fundamental wave, or the 40thorder. The power logger can display a variety of measurement parameters, including harmonic RMS values, content percentages, and phase angles, in both list and graph form. The logger can also save measured values on an SD memory card at a user-specified interval. Moreover, the optional Power Logger Viewer SF1001 PC application can be used to display time-series graphs of harmonic data on a computer, further aiding in harmonic analysis.
Features Shared with the Clamp On Power Logger PW3360-20
1. Extensive measurement capabilities in a compact package
Similar to its sister product, the PW3360-21 is 43% smaller by volume than the product it replaces (Model 3169-20/21), yet it is capable of recording power variations over extended periods of time despite this compact size. Used with a genuine Hioki SD card, it can record up to one year of measurements at one-minute intervals. The logger is designed primarily for use in applications involving the verification of energy-saving results.
The Clamp On Power Logger’s compact size allows it to be installed in confined spaces inside electrical panels, and its broad operating temperature range of -10C to 50C, which exceeds that of previous devices (0C to 40C), enables measurement in harsh environments. It can measure targets ranging from single-phase lines to three-phase/four-wire, 400 V lines.
2. Graph display that provides an instant understanding of power utilization (new feature)
With the launch of the PW3360-21, Hioki has added new functionality for displaying demand and trend graphs in both loggers. This feature makes it easy for operators to assess power use.
Demand refers to average power utilization over a specified interval, e.g., 30 minutes, and is used to determine the basic rate for electrical fees. Consequently, careful management of demand provides a means of lowering electrical fees. A demand graph can be used to check the maximum demand value and the time at which it occurred, aiding in demand management.
Users can also select one of the logger’s measurement parameters* for which to display changes in the power trend as a graph using the PW3360-21’s trend graph feature, allowing assessment of changes in power utilization based on the operating status of the equipment in question.
*Except demand and harmonics
3. Quick Set navigation helps prevent measurement mistakes
To measure power at a high level of reliability, it is necessary to properly configure settings and correctly connect the instrument to the circuit being measured. Hioki’s
Quick Set navigation function provides instructions for configuring settings and wiring modes, checking connections, and starting recording, all in a series of easy-to-understand steps. In this way, the instrument eliminates erroneous settings and connections and offers robust support for reliable measurement. The ability to display color-coded three-phase connection and vector diagrams on its color display makes it easy to visualize the measurement circuit at a glance.
4. Leak current measurement and pulse input for expanded capabilities
Combined with an optional clamp leak sensor, the PW3360-21 can be used to measure leak current. If a clamp leak sensor is used in combination with a power measurement clamp sensor, the logger can make power measurements and test for current leaks at the same time. In energy-saving programs at manufacturing plants, power consumption per unit of production is managed based on production volume and power data. The PW3360-21 accepts pulse input for tracking production volume count information, allowing it to simultaneously record power and pulse count data.
5. Continuous operation, even in locations where AC power is unavailable
When measuring or logging power in a setting such as an electrical substation, AC power supply may not be readily available. By using the optional PW9002 Battery Set, the PW3360-21 can be driven on battery power for a full work day, or approximately eight hours. Additionally, the PW9003 Power Supply Adapter can be used to draw power from measurement lines, facilitating continuous power measurement.

